
What is the Safe Income Withdrawal Rate for Retirement Income?
The safe income withdrawal rate means different things to different people. For most people, it is the amount of income you can safely withdraw from your retirement accounts each year without worrying that you will run out of income during your non-working years. The problem is, the safe income withdrawal rate is not set in stone. It changes from time to time due to varying economic and market conditions.
Planning your safe income withdrawal rate might sound simple, but it is not
When you were working and saving for retirement, you probably learned:
- A successful retirement is based on the size of your stack of cash (nest egg).
- You can live off the earnings of 4% to 8% from your retirement savings.
- Your pile of cash will either grow or at least stay level while you are taking income distributions.
- Your kids and grandkids will inherit your pile of money.
While this might sound perfect and be exactly what you want to have happen, unfortunately, it might not work this way.
Where does the Safe Income Withdrawal rate come from?
The safe income withdrawal rate is based on research. Big research companies out there run mathematical calculations, often known as Monte Carlo simulations. For these simulations, they use numerous combinations of financial products, including stocks, bonds, cash, and commodities, stir them up with their algorithms, and analyze the data produced. Their goal is to find the safe income withdrawal rate with a 90% to 95% chance that no matter your mix of retirement savings, you will not run out of income during your lifetime (typically calculated at 30 years or some other type of success probability).
What causes the safe income withdrawal rate to change?
The safe income withdrawal rate is a moving target because of changing economic conditions, updated research, and shifting financial realities, including:
- Inflation.
- Current interest rates.
- Rising life expectancy.
- Market volatility.
- Advisor fees
- Future expectation.
- National debt.
The 1980s: The Era of the 6% Rule
In the 1980s, financial institutions and planners commonly cited a 6% withdrawal rate as “safe income.” This rate was based on a 90% to 95% probability of success under historical conditions, which, at the time, included exceptionally high interest rates. If you had $1,000,000, the 6% rule said you could have an additional $60,000 of income and not worry about running out of income. Not too bad back in the 1980s.
6% seemed logical
Unfortunately, the 6% rule was based more on optimism and guesswork rather than rigorous research. With bank savings accounts yielding 8%, a 6% withdrawal rate appeared conservative. The booming stock market, declining inflation, and wide availability of pensions further reinforced this confidence. However, underlying this optimism were critical flaws. The 1987 crash revealed the danger of the Sequence of Return risk.
The Lesson Learned
Sequence of return risk is the danger that poor returns early in retirement, along with income withdrawals, could affect how long your money would last. The 6% rule did not account for the possibility that poor early returns can permanently damage your portfolio’s longevity. Historical analysis later revealed that a 6% rate succeeded only about half the time over a 30-year retirement, well below the threshold for a truly “safe income.”
The 1990s and the 5% Safe Income Withdrawal Rate
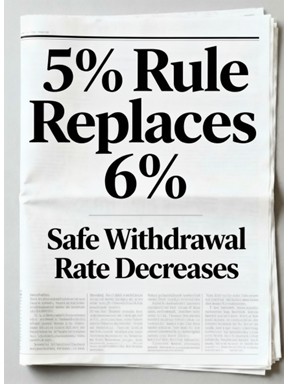
In 1990, as the market became more volatile and interest rates began to decline, the safe income withdrawal rate went from 6% to 5%. This was based on updated research and increased portfolio diversification. With diversification, rebalancing, and adjustments to withdrawals based on market performance, it was believed the safe income withdrawal rate was 5% or slightly more. Still, if you earned 5% on that same $1,000,000, you could take an additional $50,000 of income.
The Birth of the 4% Rule
In October 1994, financial planner William Bengen published a paper, “Determining Withdrawal Rates Using Historical Data”, in the Journal of Financial Planning. This groundbreaking research used historical market data to test various withdrawal rates across all rolling 30-year periods since 1926. He concluded that a retiree could withdraw 4% of their initial portfolio balance, adjusted annually for inflation, and reliably sustain income for at least 30 years, even through the worst market conditions.
Forbes describes Bengen’s rule this way: “Bengen found that retirees could safely spend about 4% of their retirement savings in the first year of retirement. In subsequent years, they could adjust the annual withdrawals by the rate of inflation. Following this simple formula, Bengen found that most retirement portfolios would last at least 30 years.”

What’s wrong with 4%?
Bengen found that even though the rule is fairly simple to apply, many failed to apply it appropriately. In the event of an era of prolonged low interest rates, combined with a 4% withdrawal rate, this combination could cause the underlying portfolio to drop to zero. If you had $1,000,000, and you withdrew 4%, you could have an additional $40,000 of income.
The 3.5% rule of 2000 to 2010
The bursting of the dot-com bubble in 2000 and the Great Recession of 2008 were disastrous. Retirees who began withdrawing before these events experienced firsthand the devastating effects of market downturns on portfolio longevity. Many financial planners adjusted safe income withdrawal rates down to around 3% to 3.5% to preserve principal under volatile conditions
In October 2004, Jonathan Guyton and William Klinger published their study, “Decision Rules and Portfolio Management for Retirees: Is the ‘Safe income’ Initial Withdrawal Rate Too Safe income?” in the Journal of Financial Planning. This paper established a new guideline of a variable 3.6% to 5.8% withdrawal rate.
CNBC describes this as “The Guardrails Approach” and “requires that retirees change their withdrawal rate based on the market performance. This approach is designed to account for changes in the value of your portfolio.” For example, when your car hits a guardrail, it gets a ding and is pushed back to the center of the road. When your portfolio hits the guardrail, it gets a ding, and you readjust.

The low bank rates of 2010 and beyond
In 2010, most advisors chose to use a safe income withdrawal rate of 3% in what became a prolonged low-interest-rate environment. Bank interest rates were dropping to all-time lows, and there was market volatility. The problem is that a low safe income rate of 3% impeded people’s ability to live the lifestyle they had dreamed of in retirement, so many people looked for alternatives.
Use a safe income withdrawal rate of 3%, and your $1,000,000 could safely produce an additional income of $30,000. That’s half of the safe income withdrawal rate of the 1980s. Fortunately, other financial instruments had become available with higher protected income values.

The Now: 2.2%, or is it?
In April 2021, Dr. Wade Pfau introduced us to an optimal withdrawal rate of 2.2% in his study, “Retirement Income Dashboard for a Benchmark Couple Both Turning 65 in April 2021”. He was then using a conservative portfolio (with a 25% stock allocation) with 2% spending COLA.
However, with a recent spike in interest rates, his rates as of January 2023 were slightly higher. You can find the report at: https://retirementresearcher.com/dashboard/
A fascinating observation by Dr. Pfau
Still talking about that couple, both age 65, Dr. Pfau suggests, “Finally, we could consider a case that integrates insurance and investments, Dr. Pfau goes on to say, “Suppose they place 30% of their assets into a SPIA. It offers a 5.1% withdrawal rate. Also, because they now have this downside protection for their spending, they start to relax more about market volatility and feel that they can behave more aggressively with their remaining investments.”
The ”SPIA” Dr. Pfau is talking about is a Single Premium Immediate Annuity, and most likely with a lifetime protected income value, and is designed to pay a guaranteed lifetime of income. He also acknowledges other insurance-based options “that preserve liquidity and upside, such as variable or indexed annuities that include a protected lifetime income benefit.”
The COVID Conundrum
In the last few years, since the COVID pandemic, interest rates have spiked. We have also seen a dramatic increase in the U.S. national debt. In October of 2024, Forbes magazine reported that Morningstar research suggested 3.7% might now be the safe income withdrawal rate.
At this point in your life, would you prefer more of a sure thing or a maybe?
While a safe income withdrawal rate might be acceptable, a guaranteed lifetime income is better. You might be one of many people nearing retirement who already have all the money they need to have a successful retirement. The only problem is that your money is not properly positioned in the correct financial instruments to maximize your protected income value.
In Conclusion:
The safe income withdrawal rate is a moving target. While the 4% rule remains a useful benchmark, you should treat it as a flexible guideline rather than a rule or guarantee. If you want to thrive in retirement, you cannot afford to run out of money, and you need a written plan that is mathematically and scientifically sound. The withdrawal rate, or better yet, the protected income value you chose, could determine if your income will ever run out. A financial professional specializing in income distribution can help you make the right decision for your unique situation.
– – – – – – – – – – – – – – – – – – – – – – – – –
About Author Steven Drahozal
Steven has been in the financial services profession since 1986. He is a small business owner of the Wealth & Income Management Group, LLC, and runs a life insurance agency. Steve has been a part of the Mature American Planning Company, a Michigan Corporation and insurance agency, since its founding in 1998.
Investment advisory services offered through Brookstone Capital Management, LLC (BCM), a registered investment advisor. BCM, the Wealth & Income Management Group, LLC, and the Mature American Planning Company are independent of each other. Insurance products and services are not offered through BCM but are offered and sold through individually licensed and appointed agents.
Any comments regarding safe income and secure products, and guaranteed income streams refer only to fixed insurance products. They do not refer, in any way, to securities or investment advisory products. Fixed insurance and annuity product guarantees are subject to the issuing company’s claims-paying ability and are not offered by Brookstone.
Index or fixed annuities are not designed for short-term investments and may be subject to caps, restrictions, fees, and surrender charges as described in the annuity contract. Guarantees are backed by the financial strength and claims-paying ability of the issuer. Please refer to the BCM firm brochure, the ADV 2A, Item 4, for additional information.